Working paper
The Window Wedge: SpaceX, Mega-IPOs, and the Difference Between a Hot Listing and a Market Top
Whether mega-IPOs like SpaceX ring the bell at a market top, or instead warn about pricing risk in the listing itself.
Aryan Patel · 2026
Read the full paper (PDF)Abstract
On 11 June 2026, SpaceX entered the public markets at a reported 1.77 trillion dollar valuation through a 75 billion dollar IPO. This paper investigates whether such mega-IPO listings ring the bell at market tops or signal pricing risk in the individual securities. Using a return-observable panel of 39 large IPO and direct-listing events from 2006 through 2026, the study examines the Window Wedge concept: the premium sellers can obtain when an unusually receptive issuance window meets assets investors badly want to own. The central finding is narrow but robust. Large IPOs raising at least 3 billion dollars lagged their local benchmarks by 14.1 percentage points over the next twelve months, while those same benchmarks rose by 8.1 percent on average. The underperformance was largest among story-heavy issuers (-23.9 pp) versus mature issuers (-5.1 pp). SpaceX fits the timing profile: it arrived near Nasdaq all-time highs after a technology-led rally and at a scale 2.55 times the largest previous deal. However, historical large IPOs did not reliably signal broad market declines afterward. The evidence points less to a market-top bell than to an issue-level pricing warning: mega-IPOs tend to concentrate valuation risk rather than signal imminent market reversals.
Key findings
- 01
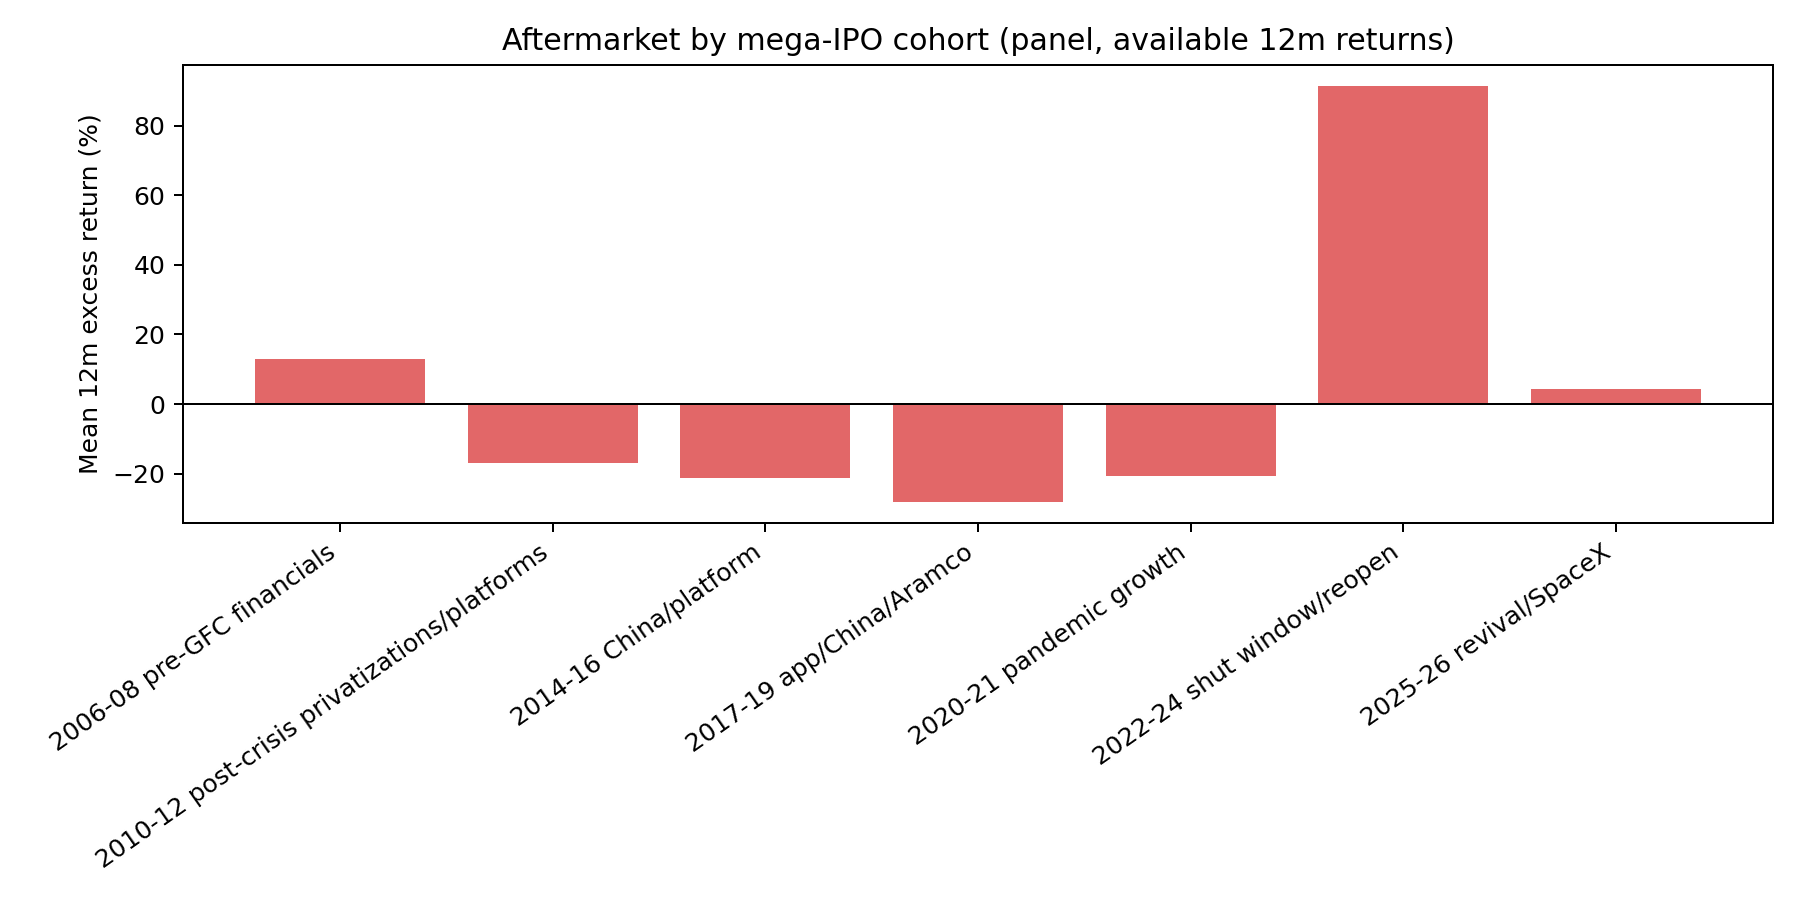
Large IPOs raising 3 billion dollars or more underperformed local benchmarks by 14.1 percentage points over twelve months on average (a 72 percent underperformance rate), even though those benchmarks rose 8.1 percent on average, indicating systematic aftermarket weakness.
- 02
Story-heavy issuers (platforms, growth narratives) showed mean 12-month excess returns of -23.9 pp versus -5.1 pp for mature issuers, and underperformed 83.3 percent of the time, so valuation risk concentrates where future cash flows are most uncertain.
- 03
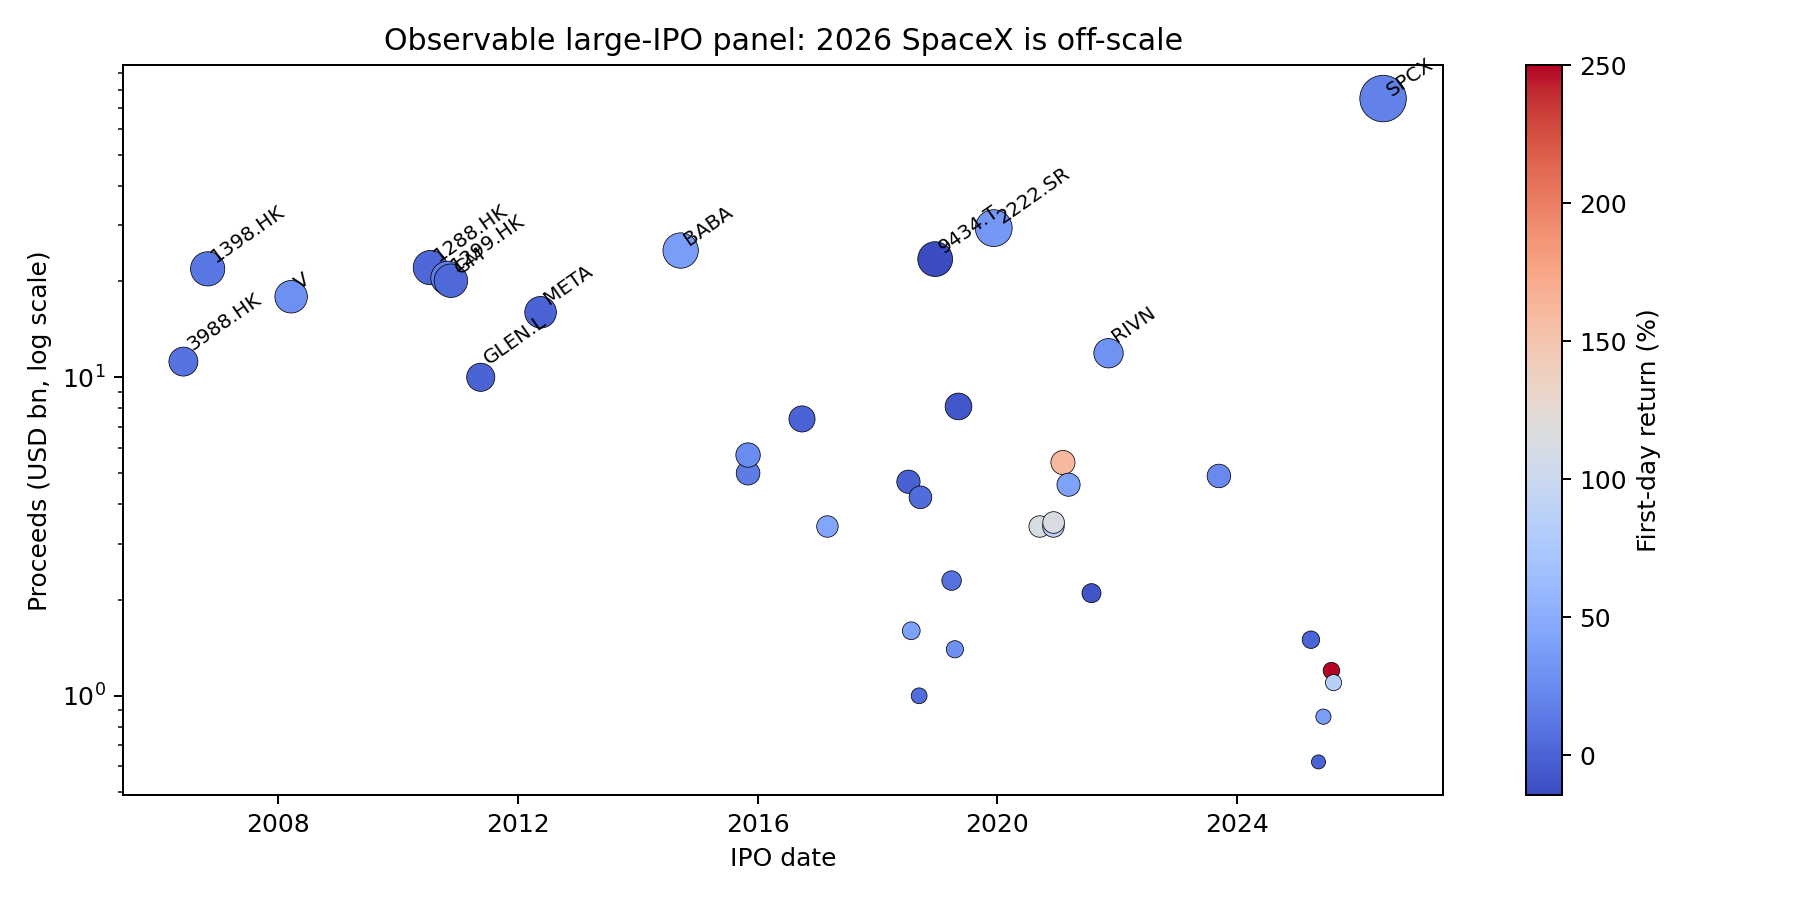
SpaceX is off-scale in the observable panel: its 75 billion dollar raise is 2.55 times the prior largest deal (Saudi Aramco at 29.4 billion dollars), arriving when Nasdaq sat in the 92.5th percentile of its trailing-year range after QQQ returned 35.8 percent over one year.
- 04
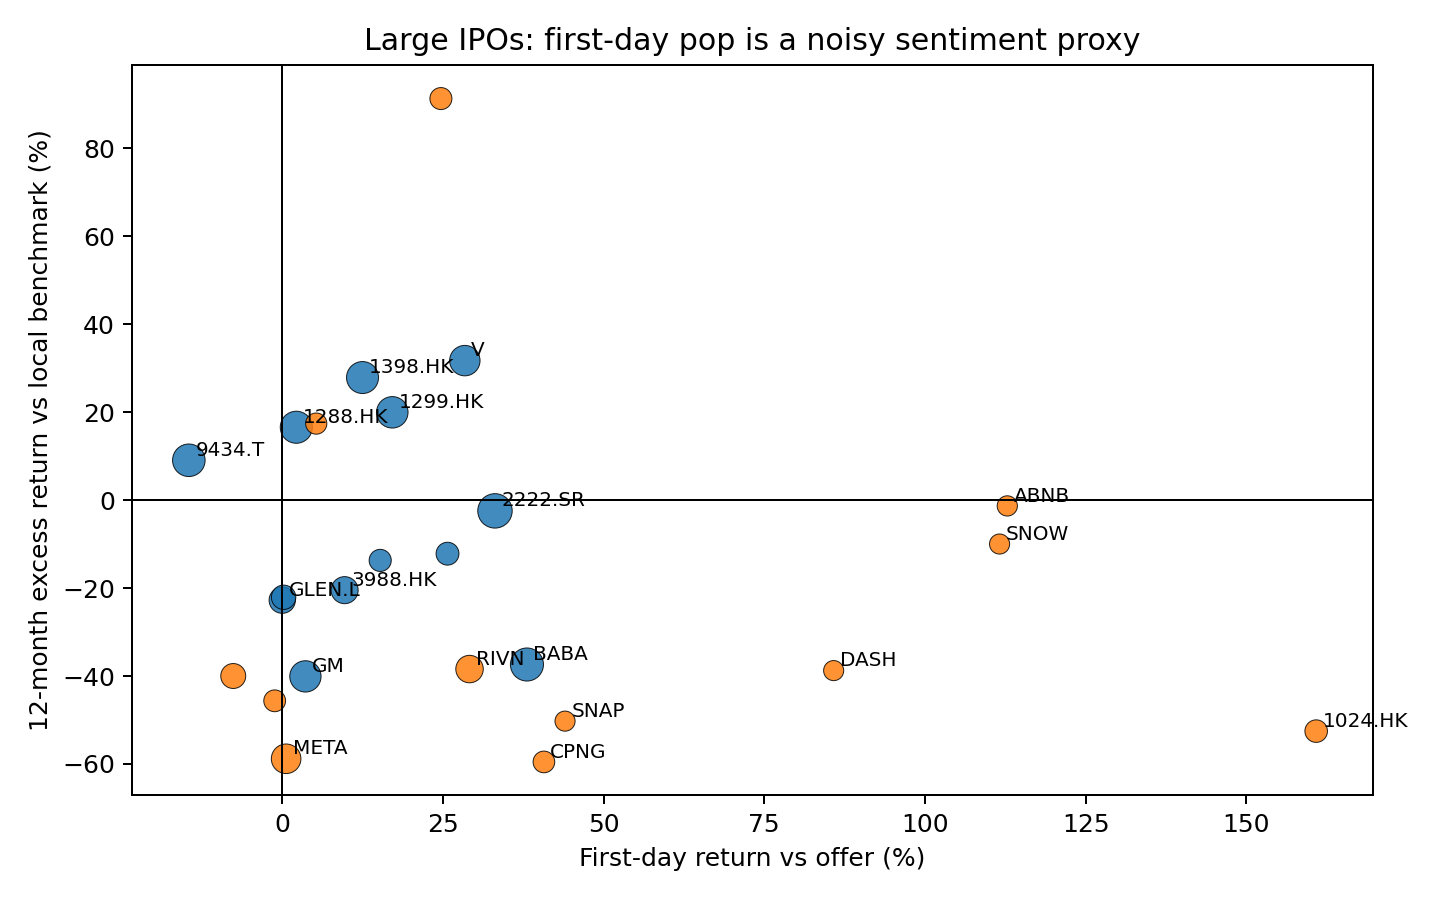
First-day IPO pops (mean 31.1 percent) are a poor signal of 12-month performance (Spearman rho = 0.045, p = 0.814), contradicting the idea that early enthusiasm predicts sustained returns.
- 05
Mega-IPOs do not reliably signal imminent broad-market declines: forward 12-month benchmark returns after historical large-IPO dates averaged +8.1 percent, in the 46.1st percentile of historical returns, which is ordinary rather than crash-like.
- 06
The Window Wedge mechanism explains how issuers with long-duration, unverifiable future payoffs price differently when willingness to fund risky growth is elevated, so the same company can be both strategically important and priced with little margin for near-term disappointment.
Figures
How the method works
The study builds a return-observable panel of 39 large IPO and direct-listing events from 2006 through 2026, combining daily adjusted closing prices with manually curated proceeds, offer prices, listing dates, and issuer classifications. Large offerings are those raising at least 3 billion dollars. Returns are buy-and-hold from first close to horizon, and excess returns are the stock return minus a same-market benchmark (such as Nasdaq for US listings) rather than a global index.
Performance is decomposed by cohort (pre-GFC financials, post-crisis privatizations, China and platform listings, pandemic growth, and the SpaceX-led reopening) and by issuer type. Story issuers are classified by listing-date features (venture-scale growth, thin or negative earnings, platform economics, long-duration technology options); mature issuers by long revenue history, proven profitability, state ownership, or established market role. Cross-sectional analysis relates first-day returns to 12-month excess returns with Spearman correlation and small-sample regression.
The Window Wedge framework writes the listing price as P = F + W times S, where F is fundamentals, W is the market-wide willingness to fund distant growth, and S is the issuer's sensitivity to that willingness. The mechanism predicts that large offerings cluster in strong markets, that newly listed stocks often underperform as the window fades, that story-heavy issuers are more fragile than mature ones, and that broad-market returns need not weaken after IPO dates. Deal-level bootstrap resampling with 95 percent confidence intervals reflects the small sample.
Data
A return-observable panel of 39 large IPO and direct-listing events, 2006 to 2026, using daily adjusted prices with manually curated proceeds, offer prices, and issuer classifications; same-market benchmarks; deal-level bootstrap for uncertainty.
How to read this
- The panel is 39 visible mega-IPOs; smaller offerings are excluded, so the findings apply to large capital raises, not the broader IPO universe.
- SpaceX is unprecedented in scale (2.55 times the prior maximum), so extrapolating historical returns to it is speculative; the offering details and market dynamics are as of mid-2026 and subject to change.
- The study measures historical performance, not forward returns. Past underperformance of large IPOs does not guarantee SpaceX will underperform; it describes a pattern in the sample examined.
- Returns and benchmarks are observed after the fact; forward returns depend on future conditions, and nothing here is investment advice or a price target.
- The Window Wedge model (P = F + W times S) is a stylized framework to organize thinking, not a calibrated pricing model.